Follow us on Facebook
Breaking updates in your feed — tap to open
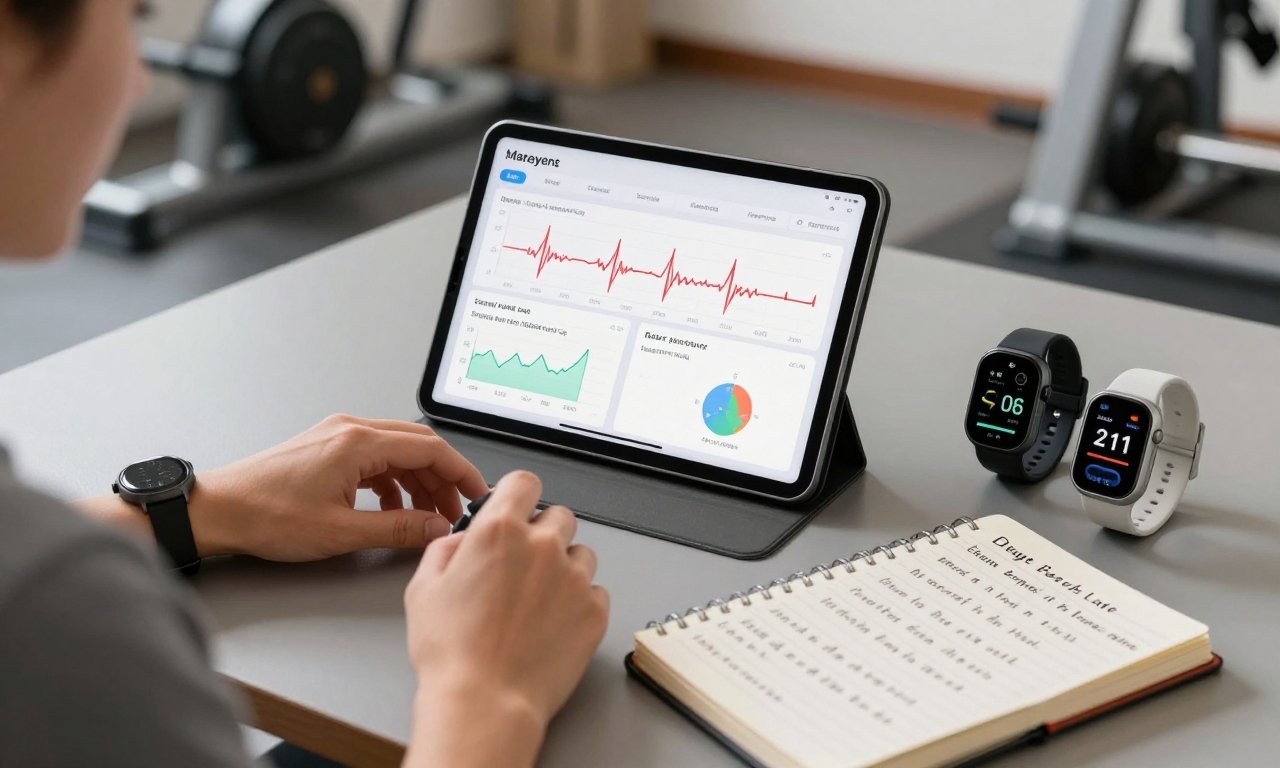
If you wear a smartwatch or fitness tracker, you’ve probably glanced at your resting heart rate (RHR) at some point. Maybe you’ve noticed it’s lower on days after a good workout, or higher when you’re feeling under the weather. But what you might not realize is that this simple number-often displayed alongside your step count and calories burned-is one of the most scientifically validated and meaningful health metrics your wearable provides.
Recent validation studies have shown something remarkable: the RHR measurements from consumer wearables like Apple Watch, Fitbit, Garmin, and Samsung Galaxy Watch achieve near-medical-grade accuracy during rest conditions. This isn’t just a rough estimate-it’s reliable data that can tell you important things about your health. In this deep dive, we’ll explore why RHR matters, what it can reveal about your body, and how to use this information to make smarter decisions about your fitness and health.
- The Science Behind Wearable Heart Rate Accuracy
- Three Key Health Insights from Your Resting Heart Rate
- 1. Cardiovascular Fitness Indicator
- 2. Mortality Risk Predictor
- 3. Early Illness Detection System
- Understanding Your Personal Heart Rate Patterns
- The Circadian Rhythm of Heart Rate
- Establishing Your Personal Baseline
- Practical Applications for Wearable Users
- For Fitness and Training
- For Health Monitoring
- For Specific Wearable Platforms
- Limitations and Considerations
- Making Your RHR Data Actionable
The Science Behind Wearable Heart Rate Accuracy
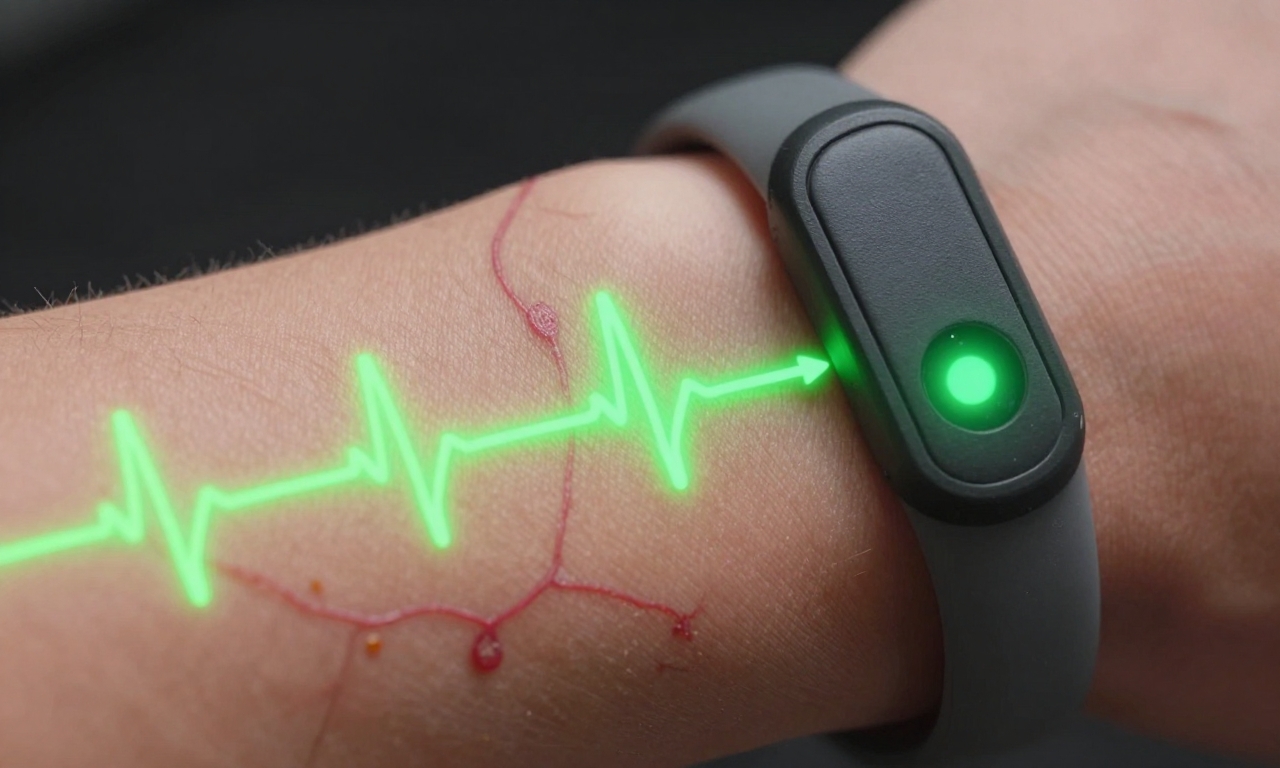
You might wonder how a device on your wrist can measure your heart rate with medical-grade precision. The answer lies in photoplethysmography (PPG), the technology most wearables use. Here’s how it works:
- Light-based measurement: Your wearable emits green LED light into your skin
- Blood flow detection: The sensor detects changes in light absorption as blood pulses through your capillaries
- Algorithm processing: Sophisticated algorithms filter out noise and movement artifacts
- Rest condition optimization: Accuracy is highest when you’re still, which is why RHR measurements are so reliable
Multiple independent studies have validated wearable RHR accuracy. Research published in the Journal of Medical Internet Research found that devices like Apple Watch Series 6 and Fitbit Charge 4 showed excellent agreement with electrocardiogram (ECG) measurements during rest, with correlation coefficients above 0.95. This means when you’re sitting still or sleeping, your wearable is giving you data that’s nearly as good as what you’d get in a doctor’s office.

Three Key Health Insights from Your Resting Heart Rate
1. Cardiovascular Fitness Indicator
Your RHR is like a fitness report card. A lower resting heart rate typically indicates better cardiovascular conditioning. Here’s why:
- Stronger heart muscle: A well-conditioned heart pumps more blood with each beat
- Increased stroke volume: More efficient circulation means fewer beats are needed
- Improved autonomic regulation: Better balance between sympathetic and parasympathetic nervous systems
For most adults, a normal RHR ranges from 60-100 beats per minute (bpm). Well-trained athletes often have RHRs in the 40-60 bpm range. If you’re consistently seeing your RHR decrease over weeks or months of regular exercise, that’s a clear sign your cardiovascular fitness is improving.
2. Mortality Risk Predictor
This might sound alarming, but it’s important information: your RHR independently predicts mortality risk. Large-scale epidemiological studies have found that every 10 bpm increase in resting heart rate is associated with approximately 9% higher all-cause mortality. This relationship holds true even after adjusting for other risk factors like age, blood pressure, cholesterol, and smoking status.
Why does this correlation exist? Researchers believe several mechanisms are at play:
- Cardiac workload: Higher RHR means your heart is working harder all the time
- Autonomic imbalance: Elevated RHR may indicate sympathetic nervous system dominance
- Systemic inflammation: Higher RHR correlates with inflammatory markers like C-reactive protein
3. Early Illness Detection System
Your wearable can serve as an early warning system for health issues. A sustained elevation in RHR above your personal baseline-typically 5-10 bpm higher than normal for several days-can signal:
- Infection: Your body raises heart rate to support immune response
- Overtraining: Inadequate recovery from exercise
- Dehydration: Reduced blood volume requires faster heart rate
- Stress or anxiety: Increased sympathetic nervous system activity
- Cardiovascular issues: Early signs of potential problems
Understanding Your Personal Heart Rate Patterns
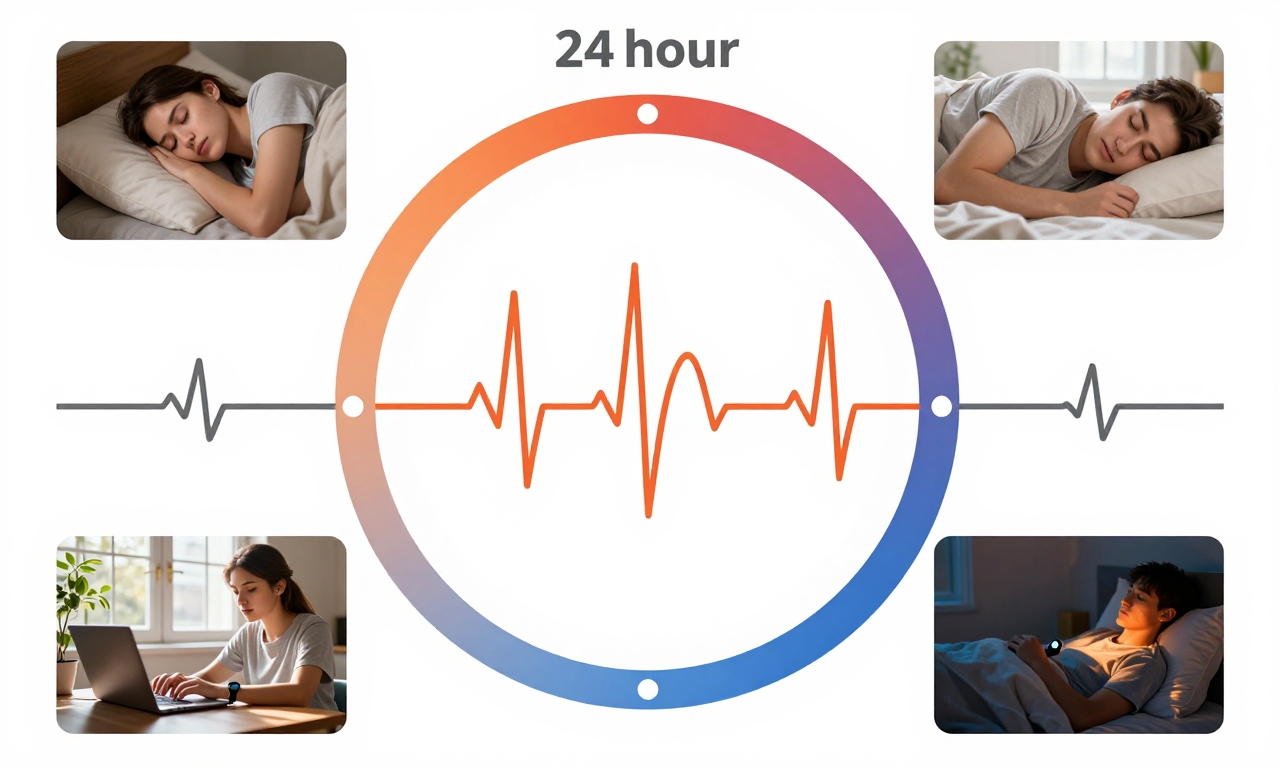
The Circadian Rhythm of Heart Rate
Your heart rate follows a natural daily pattern called circadian rhythm. Understanding this pattern helps you interpret your data correctly:
| Time of Day | Typical Heart Rate Pattern | Physiological Reason |
|---|---|---|
| Early Morning (4-6 AM) | Lowest point | Parasympathetic dominance during deep sleep |
| Morning Wake-up | Sudden increase | Cortisol release and sympathetic activation |
| Afternoon (2-4 PM) | Peak levels | Natural circadian peak, often with lunch digestion |
| Evening | Gradual decline | Preparation for sleep, parasympathetic increase |
This natural variation is why continuous monitoring through wearables is more valuable than single measurements. Your 2 PM reading will naturally be higher than your 4 AM reading-and that’s completely normal.
Establishing Your Personal Baseline
Instead of comparing yourself to population averages, the most valuable approach is to establish your own baseline. Here’s how:
- Track consistently: Wear your device regularly, especially during sleep
- Look at weekly averages: Daily fluctuations are normal; weekly trends are more meaningful
- Consider context: Note factors like exercise, stress, illness, and menstrual cycle
- Give it time: Establish baseline over 2-4 weeks of normal activity
Once you know your normal range, you can better identify meaningful changes. A gradual decrease over months likely indicates improved fitness. A sudden, sustained increase might warrant attention.
Practical Applications for Wearable Users
For Fitness and Training
Your RHR data can guide your exercise routine in several ways:
- Recovery monitoring: If your morning RHR is elevated by 7+ bpm, consider a lighter workout or rest day
- Progress tracking: Gradual RHR decreases over months confirm fitness improvements
- Overtraining prevention: Consistently elevated RHR may signal need for deload week
- Workout intensity adjustment: Use RHR trends to periodize your training
“The most valuable insight from wearable RHR data isn’t any single measurement-it’s the trend over time. Patterns tell the real story.”
For Health Monitoring
Beyond fitness, RHR can serve as a general health barometer:
- Illness early warning: Notice RHR elevation before symptoms appear
- Stress management: Elevated RHR can prompt mindfulness or relaxation practices
- Medication effects: Some medications affect heart rate; monitor changes
- Lifestyle impact: See how sleep, alcohol, or caffeine affect your numbers
For Specific Wearable Platforms
Different wearables handle RHR data slightly differently:
- Apple Watch: Uses background readings throughout day, emphasizes sleep RHR
- Fitbit: Provides detailed sleep RHR graphs and cardio fitness scores
- Garmin: Offers stress tracking based on heart rate variability alongside RHR
- Samsung Galaxy Watch: Integrates RHR with blood pressure and ECG features
- Wear OS devices: Various apps provide different analysis approaches
Limitations and Considerations
While RHR from wearables is remarkably accurate, there are important limitations to understand:
- Individual variation: Normal ranges differ based on age, genetics, medications
- Measurement conditions: Accuracy decreases with movement, loose fit, or tattoos
- Not diagnostic: Wearables provide information, not medical diagnosis
- Context matters: Always consider RHR alongside other symptoms and factors
- Device differences: Various wearables may show slightly different values
If you notice concerning patterns-like consistently elevated RHR without explanation, or sudden dramatic changes-consult a healthcare professional. Your wearable data can provide valuable context for medical discussions.
Making Your RHR Data Actionable
Here’s a simple framework for using your resting heart rate data effectively:
- Establish baseline: Track consistently for 2-4 weeks to find your normal range
- Monitor trends: Look at weekly averages rather than daily fluctuations
- Note context: Record exercise, stress, sleep, illness, and other factors
- Watch for patterns: Gradual decreases (good), sudden sustained increases (investigate)
- Take appropriate action: Adjust training, monitor health, or consult professional as needed
Among all the metrics your wearable tracks-steps, calories, sleep stages, oxygen saturation-resting heart rate stands out as both accurately measured and physiologically meaningful. It bridges the gap between fitness tracking and health monitoring, providing insights that are both immediately practical and potentially life-saving.
Your wearable isn’t just counting steps or tracking sleep-it’s giving you a window into your cardiovascular system. By understanding what your resting heart rate really means and how to interpret the patterns, you transform raw data into actionable knowledge about your body. Whether you’re optimizing your training, monitoring your health, or simply satisfying your curiosity about how your body works, your RHR data is one of the most valuable features your wearable offers.